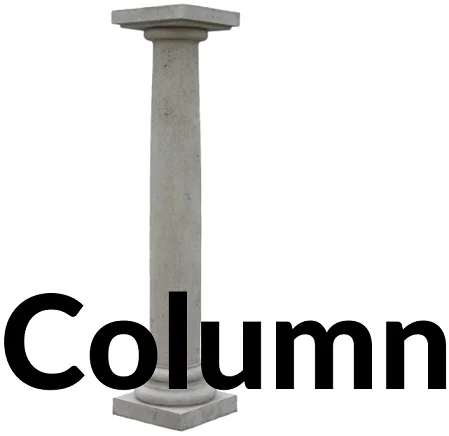
Visual Trick: C is for Column, R is for Row
I’ve always had trouble distinguishing between columns and rows in Excel. I would often get confused when organizing data, deleting columns/rows, or pasting data. Thanks to a colleague who taught me a simple trick, I now have a clear understanding with just one image. I welcome sharing this with friends who struggle with identifying columns and rows!
In English, “column” means a pillar, and pillars are straight up, so “column” is easy to remember as vertical! Once you identify Column, Row must be the horizontal ones. This is a technique that utilizes refined memory in education, making the brain remember in a more profound way, such as memorizing English words with example sentences, visual images, or storytelling methods. The image above follows the same approach. If you know someone who struggles with identification, share this article with them!


Train Car Analogy (by Anonymous)
Think about a “row of train cars”—they’re connected horizontally. That’s how rows behave in Excel, one after another across the sheet.
What Happens When You Confuse Rows and Columns?
Mixing them up can lead to real issues when working in Excel. Here are some common mistakes:
VLOOKUP Doesn’t Work as Expected
VLOOKUP only searches from left to right across columns. If your lookup value is in a row, not a column, your formula will break.
=VLOOKUP("Taipei", A2:E10, 3, FALSE)If “Taipei” is in the first row instead of the first column, the formula won’t work.
Fix: Make sure the lookup range starts with the correct column.
TRANSPOSE Flips the Wrong Way
The TRANSPOSE function changes vertical data to horizontal or vice versa. If you mistake a row for a column, you’ll end up with misaligned data.
Example: Trying to convert a list of months into a horizontal format, but the original data is already in a row—now the result is messy.
Bad Table Layout Ruins Analysis
Some users place item names in rows and numbers in columns, which may look fine visually but messes up filtering, pivot tables, and formulas.
❌ Bad Example:
| North | Central | South | |
|---|---|---|---|
| Sales | 50,000 | 43,000 | 48,000 |
| Cost | 32,000 | 28,000 | 30,000 |
This layout uses regions as column headers and items in rows. Many Excel tools won’t interpret this correctly.
✅ Recommended Layout:
Flip it! Place items like “Sales” and “Cost” in columns, and use rows for regions or time periods. This is better for formulas and charts.
#REF! Errors in Formulas
Using the wrong row/column reference can cause Excel to show #REF!, meaning the cell reference is invalid. This often happens when:
- Dragging formulas across rows instead of columns (or vice versa)
- Referencing cells that were deleted
- Confusing the index in functions like INDEX, OFFSET, etc.
Learn More Excel Tips
Want to boost your Excel skills? Explore more guides like this on our Tech blog and don’t forget to bookmark this page!